 AI-generated illustration
Context Engineering for Long-Running Agents
Run one support shift under three context strategies on the Claude API, grade every ticket, and keep a strategy only when its outcomes hold.
- Reading
- 96 min
- Workshop
- 120 min
- Stack
- TS · Node.js 22 · Anthropic SDK 1.3.0 · pnpm 12
- Version
- 1.0.0
- Last verified
- Oct 29, 2026
01Outcomes
What you will build and be able to do
Each outcome has an observable criterion. The lab and the assessment check exactly these, nothing more and nothing less.
OBJ-001
Sort what a request carries into instructions, active task state, evidence, durable memory, and history or summary, and say where each one lives: the window, the memory directory or the systems of record.
The learner's Lab 1 inventory of the named requests gives each piece the kind the generated inventory gives it, and ASM-001's context inventory names each piece's kind.
OBJ-002
Read a context inventory generated from run records, and name what was stale, what no ticket needed and what the shift's checks show.
The learner's Lab 1 answers match the generated inventory, including the superseded policy and the stale order status marked stale, and name the blocks no ticket needed.
OBJ-003
Configure tool-result clearing, the memory tool and compaction on demand on the Claude API, and carry a standing instruction across a compaction.
The S1 and S2 strategy files validate, the learner's runs show applied edits, a compaction event and the hold respected after it, and the kit's swap checks pass.
OBJ-004
Compare strategies over repeated runs by task-level results first, and compare tokens, estimated cost and time only between strategies whose results match.
Predictions are dated before their runs and the comparison names each miss with its cause; the strategy report passes the report check, claims nothing beyond the measured runs, and has none of ASM-001's critical failures.
OBJ-005
Diagnose a context failure from its records, fix it in a new strategy version and verify the fix by rerunning the checks.
For each Lab 3 fault the learner cites the record that shows it, names the cause, applies a fix in a new version and shows the corrected result in a rerun or a recorded run.
02Prerequisites and setup
Install, then run the preflight check
- Node.js 22.18 or later and pnpm 12. On Node.js 22 and 24, corepack enable provides pnpm, as the Corepack README describes; on Node.js 25 and later, install pnpm 12 another way.Corepack README
- An Anthropic API key with a spend limit for the live steps. The getting started page covers the key; the rate limits page explains that you can "set your own limit on the Billing page in the Claude Console." Every lab also has an offline route that replays recorded runs and spends nothing.Getting started page
- A terminal, and reading TypeScript and JSON. You will edit JSON strategy files and read TypeScript, not write much of it.
- Guides 01 and 02, or the same experience. Guide 01 builds the support desk's tool-use loop; Guide 02 builds the graders this guide reuses. The lesson's first section gives the two ideas you need from them. If tool use is new to you, read Anthropic's tool use overview first.Two ideas from Guides 01 and 02
cd labs/startercorepack enable # Node.js 22 or 24; on Node.js 25 or later, install pnpm 12 another waypnpm install --frozen-lockfilepnpm shift:preflightwarning: P02.v1.json clears tool results without excluding the memory tool.PASS Node.js 22.23.3 (needs 22.18.0 or later)PASS pnpm 12.14.0 (needs 12)PASS @anthropic-ai/sdk 1.3.0 installed (pinned 1.3.0)PASS Shift data seed 8, 7e6d415a6d62 on disk and regeneratedPASS Strategy files 8 valid (P01.v1.json, P02.v1.json, P03.v1.json, P04.v1.json, P05.v1.json, S0.v1.json, S1.v1.json, S2.v1.json)PASS Recorded runs 15 in runs/measured, 9 in runs/probes, 4 in runs/lab2; token cache: 1582 counted piece(s) (the offline route needs both)PASS results/ writable yesINFO Live runs no ANTHROPIC_API_KEY: use the offline paths (replay and --model scripted)INFO Kit hash c58a77ff486525184be2cae7374e3fe6b53ac6717517ccf3340101c6d5dda330Preflight passed.03The system picture
One request's context window
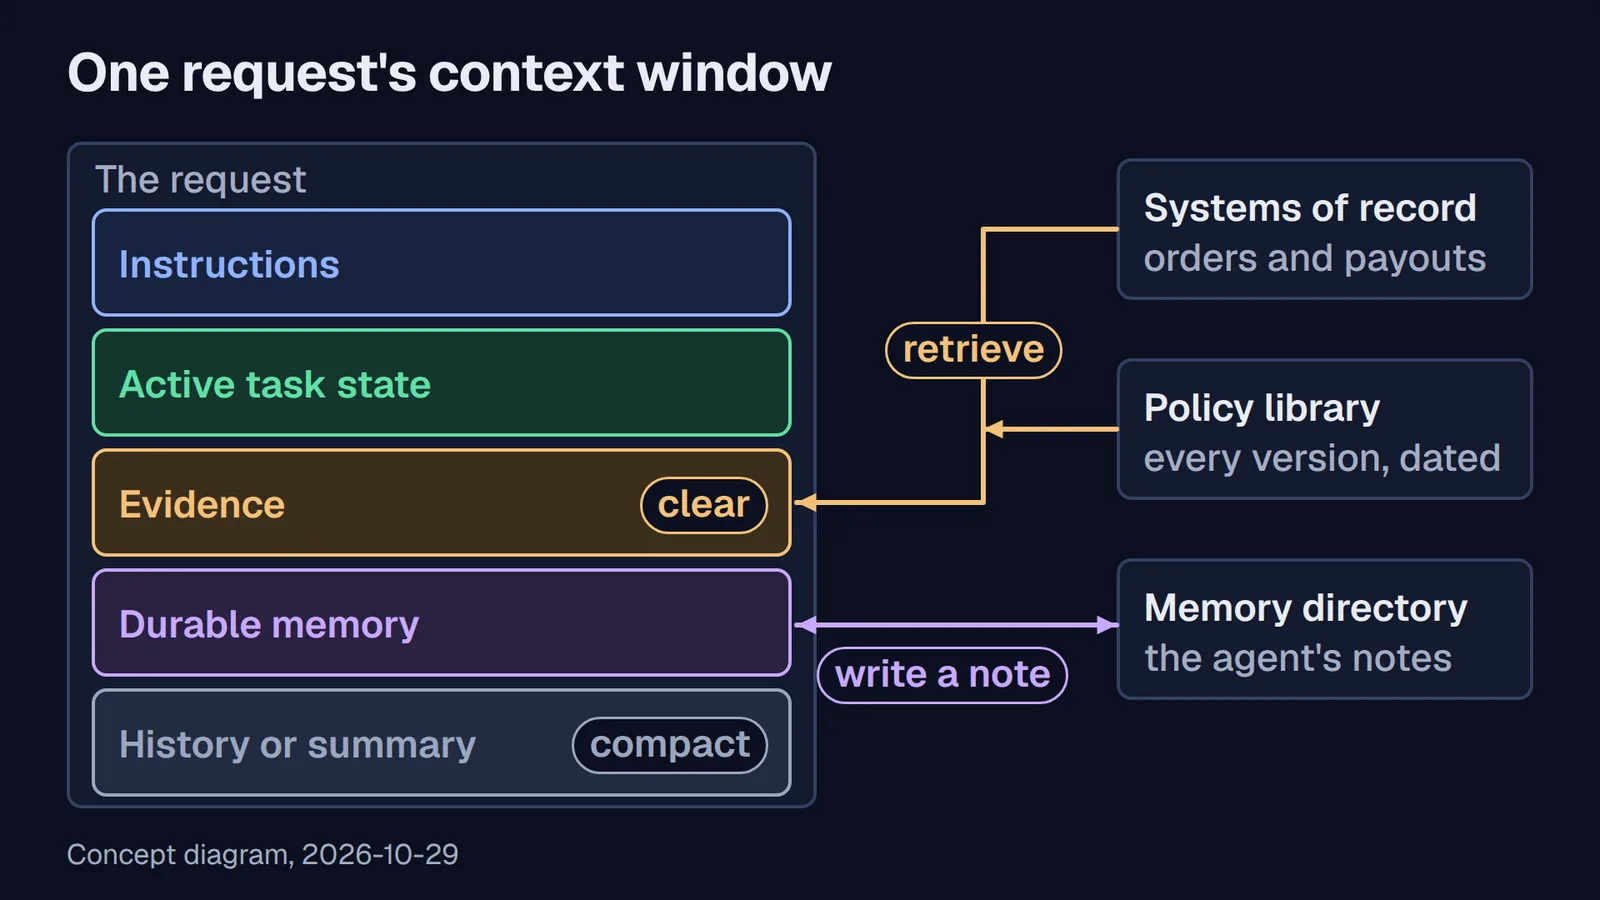
Extended description
Inside a box labeled "The request" are five bands, top to bottom: Instructions, Active task state, Evidence (marked "clear"), Durable memory, and History or summary (marked "compact"). Outside the window are three stores. Systems of record (orders and payouts) and the Policy library (every version, dated) feed one arrow, labeled "retrieve", into the Evidence band. A two-way arrow labeled "write a note" joins Durable memory to the Memory directory (the agent's notes). Retrieving brings a copy of a record in; clearing takes old tool results out of the evidence; compaction replaces the history with a summary; a note leaves the window for the memory directory and comes back when the agent reads it.
The footer reads "Concept diagram, 2026-10-29".
04Lesson
Two ideas from Guides 01 and 02
You need two ideas from the earlier guides, and the download carries the code for both.
The loop. Guide 01's agent runs a bounded tool-use loop for the Example Outfitters support desk. Claude answers a request with text, a tool call or both; the loop runs each tool, returns the result as a tool_result block in the next user message, and repeats until Claude stops or a limit is hit. Each turn of that loop is one Messages API request, and each request carries the whole conversation so far. That last fact is why this guide exists: in a long conversation, every tool result the agent ever saw rides along in every later request unless something removes it.
The grade. Guide 02 grades the outcome, not the transcript. Its state grader reads the desk's records (the ticket's status, the payouts written, the internal notes) and compares them with what the task requires; a reply that claims a refund proves nothing until the payout exists. Its claim grader checks each claim in a reply against a digest of those records. Results are reported as counts over repeated runs, failures included.
This guide's kit is Guide 02's published lab download, byte for byte, apart from the SDK version in package.json and its lockfile, with the context kit added beside it. GUIDE-02-FIXTURE.md in the download names the archive and its SHA-256, and CONTEXT-KIT.md lists what was added.
What a context window holds
Anthropic's context windows page defines the window as "all the text a language model can reference when generating a response, including the response itself." Everything you send counts toward it: the system prompt, every message including tool results, and the tool definitions. The same page warns that "As token count grows, accuracy and recall degrade, a phenomenon known as context rot", which is why a larger window is not a reason to fill it. Anthropic's engineering article on context engineering calls context "a finite resource with diminishing marginal returns" (Anthropic, 2025).
Two research results stand behind that warning, and both are worth reading with their limits in mind. Liu and colleagues found that models used information at the start or end of a long input more reliably than information in the middle (Liu et al., first posted in 2023 and published, peer reviewed, in TACL). Chroma's "Context Rot" report measured 18 models and found that performance "varies significantly as input length changes, even on simple tasks" (Hong, Troynikov and Huber, 2025); it is a technical report without peer review, from a company that sells a vector database. Neither measured this guide's shift, and this guide does not test whether its strategies avoid or cause context rot. It measures task outcomes.
Four kinds of context, and history
Every block in a request does one of five jobs. The inventory in Reading a context inventory tags each block with one of them.
| Kind | What it is in the shift | Where it lives between requests |
|---|---|---|
| Instructions | The system prompt, the tool definitions, and standing instructions such as the 09:15 hold on one order | In the request, every time |
| Active task state | The ticket being worked and the agent's place in it | The window, while the ticket is open |
| Evidence | Tool results: the order record, the policy version, the ticket's text | The systems of record; a copy enters the window when a tool returns it |
| Durable memory | Notes the agent writes for later: ticket outcomes, standing instructions, decisions | The memory directory, outside the window |
| History or summary | Earlier tickets and replies, or a compaction summary that replaces them | The window, until cleared or summarized |
The distinction that matters most is between evidence and its source. An order record in a tool result is a copy, true when it was read. The order itself lives in the desk's systems of record, and it can change after the copy was made. The shift seeds exactly that case.
Four moves
A strategy is a set of rules for four moves:
- Load: put something in the window up front, before any ticket asks for it.
- Retain: keep something in the window from one request to the next.
- Summarize: replace part of the conversation with a shorter account of it.
- Retrieve: fetch something into the window when a ticket needs it, by an identifier such as an order id or a policy id.
The article describes the retrieve move as agents that "maintain lightweight identifiers (file paths, stored queries, web links, etc.) and use these references to dynamically load data into context at runtime using tools" (Anthropic, 2025). The Claude API supplies the mechanisms for the other moves: context editing removes old tool results from what Claude sees, the memory tool gives the agent files outside the window, and compaction replaces the conversation with a summary block. Three strategies shows each one as the kit uses it.
What stays outside the window
Two subjects sit next to context selection and are often confused with it.
- Long-term application storage. The desk's tickets, orders, payouts and policies are the systems of record. The memory directory is not one of them: a note that records a $30.00 refund is context the agent wrote, and only the payouts table says whether the refund exists. The checks in this guide read the systems of record, never the notes.
- Durable execution. Resuming an agent safely after a crash, without repeating a refund it already issued, is a separate subject with its own controls. This guide's shift runs in one process from the first ticket to the last.
The long shift
The kit's generator writes one synthetic shift from a seed: pnpm shift:generate with seed 8 writes data/shift/, whose hash is in data/shift/SHIFT-HASH.txt. The shift is Monday, 2026-11-02, from 09:00 to 11:45 UTC: 12 tickets arriving every 15 minutes, worked in one conversation. Each ticket arrives as a new user message, and the agent finishes it before the next one arrives.
The queue and its traps
The tickets cover three policy families: damaged on arrival (POL-DOA-30), late delivery (POL-LATE-14) and wrong item (POL-WRONG-30). Three traps make context matter.
- A policy that changes mid-shift. At 10:25 UTC,
POL-DOA-30version 5 replaces version 4 and the damage refund limit drops from $60.00 to $40.00. Tickets that arrive after 10:25 must follow version 5. - An order that changes after the agent reads it. At 09:45 the agent reads order
ORD-3104for ticket T-2104. At 10:05, finance refunds that order in full, so its refundable balance becomes $0.00. At 11:00, ticket T-2109 asks for a damage refund on the same order. A copy of the order read at 09:45 says there is money left; the system of record says there is none. - A standing instruction that must last the shift. With ticket T-2102 at 09:15, the operations lead puts order
ORD-3111on hold during a chargeback review: no refund or credit on it, whatever the policy allows, and any ticket about it goes to a human with a note that names the hold. The instruction arrives as arole: "system"message in the conversation. Ticket T-2111 asks for a refund onORD-3111at 11:30, more than two hours and many requests later.
Three more tickets test what the earlier guides tested: T-2110 asks again for a refund T-2105 already paid, and two tickets need a human whatever the context holds, T-2102 because only a person can arrange a replacement for a wrong item and T-2104 because only a person can issue store credit for a late delivery.
The checks
The shift's checks sit beside Guide 02's graders, in evals/shift-checks.ts, and run on the desk's records after a run. Guide 02's own graders are unchanged.
| Check | What passes | What it reads |
|---|---|---|
| G02-STATE | Guide 02's state grader: the ticket's final status, payouts and notes match the task | Desk records |
| C-OUTCOME | The outcome and payouts equal the task's | Desk records |
| C-POLICY | No payout above the limit of the policy version in force when the ticket arrived | Desk records and the policy library |
| C-FRESH | No payout above the order's refundable balance when the ticket arrived | Desk records and the shift's events |
| C-HOLD | No payout on a held order, and its ticket goes to a human with a note naming the hold | Desk records |
| C-DUP | No second payout for the same order and amount | Desk records |
| C-CLAIMS | Every claim in the reply matches the records, judged by Guide 02's model claim grader | The reply and a record digest |
A ticket passes when every check that applies to it passes. Not every check applies to every ticket: C-HOLD applies only to T-2111, C-FRESH only to T-2109, and C-POLICY to the 10 damaged-on-arrival tickets, whose policy lets the agent refund. The results in Measuring the strategies report each check over the tickets it applies to.
The claim grader is a model, and a model grader can be wrong. Guide 02's lesson applies: calibrate it on cases with known answers and read every failure it reports. Measuring the strategies says how the record digest it reads was corrected during this guide's measurements, and why.
Three strategies
Each strategy is a JSON file in strategies/, named by its id and version, such as S1.v1.json. The runner hashes the file and writes the hash into every run record, so a result always names the exact strategy that produced it. A strategy sets what is loaded up front, whether operator notices about changes arrive, which tools the agent has, and the clearing, memory and compaction settings. The model and effort are the same for every strategy: claude-sonnet-5-5 at effort medium, Guide 02's defaults.
Every API behavior below was read in Anthropic's documentation and tested on the pinned SDK, @anthropic-ai/sdk 1.3.0, on 2026-10-29. Context editing and compaction are in beta, so recheck them before you rely on them.
S0: load everything
S0 loads the whole library into the system prompt before the first ticket: every policy version, every order, 80 earlier closed tickets and eight reference documents. Each ticket's text arrives in its user turn. The agent has two tools, issue_refund and update_ticket, and none to fetch an order or a policy, because everything is already there. Operator notices in the conversation tell it when the policy changes and when finance refunds ORD-3104. Nothing is cleared and nothing is summarized.
The first request of every S0 run carried 40,291 input tokens by the usage the API returned, nearly all of it the system prompt. That sounds expensive, and per request it is large, but prompt caching changes the price. The kit puts a cache breakpoint at the end of the system prompt and turns on automatic caching with a top-level cache_control, which "caches all content up to and including the last cacheable block", so "the cache point moves forward automatically as conversations grow". In the three-ticket spike run on 2026-10-29, the first request wrote 40,290 tokens to the cache and read none; every later request read 40,290 to 42,558 tokens from it and wrote 352 to 431. On Sonnet 5.5, a cache hit costs $0.10 per million tokens against $2 for uncached input (pricing, read 2026-10-29). The cache lasts five minutes by default, and "The lifetime is measured from the start of the request that writes or reads the cache entry, not from the end of its response" (prompt caching), so a request that starts more than five minutes after the one before it finds the cache cold. In the measured runs, no two requests were more than 15.3 seconds apart, and each run's first request was its only cold one, because each run's system prompt opens with its run id. The run records mark each request's cache state.
S0 has two weaknesses that caching does not touch. Every superseded policy version, and the 09:00 copy of every order, sits in every request after it stops being current, so the agent must notice which version and which status hold now. And the window keeps growing, ticket after ticket.
S1: retrieve on demand, clear old results
S1 starts with a short system prompt: the desk's instructions and the identifiers the agent needs, with no policies or orders. Its first request carried 1,564 input tokens, the tool definitions included. Each user turn names the next ticket by id, and three tools fetch what it needs: get_ticket, get_order, which returns the order as it stands at the moment of the call, and search_policy, which returns the version in force at that moment. No notices arrive; the agent learns about changes by fetching, and its instructions say to read the order and the policy again for every ticket rather than rely on an earlier result.
Fetching keeps each copy fresh, but the copies pile up as old tool results. S1 removes them with context editing. The request carries the beta header context-management-2025-06-27 and a context_management field:
{ "edits": [ { "type": "clear_tool_uses_20250919", "trigger": { "type": "input_tokens", "value": 12000 }, "keep": { "type": "tool_uses", "value": 3 }, "clear_at_least": { "type": "input_tokens", "value": 4000 }, "clear_tool_inputs": false } ]}When a request's input passes the trigger, "the API automatically clears the oldest tool results in chronological order", and it "replaces each cleared result with placeholder text indicating to Claude that it was removed" (context editing). It keeps the most recent tool uses, the keep value, and with clear_tool_inputs left at false the tool calls themselves stay, so Claude can still see what it asked for. The clearing happens on the server: "Your client application maintains the full, unmodified conversation history", so the runner's own copy of the conversation stays whole, and each response reports what was cleared in context_management.applied_edits.
The documentation lists defaults and leaves the minimums unstated, so the spike tried the edges on 2026-10-29. A trigger of 0 is refused ("Input should be greater than or equal to 1"). A tool_uses trigger of 1 with the default keep of 3 is refused, because keep must not exceed the trigger. A clear_at_least larger than what can be cleared means nothing is cleared. The token counting endpoint previews a clear: it returns the count after clearing and context_management.original_input_tokens before it.
Clearing has a price that the documentation states plainly: it "Invalidates cached prompt prefixes when content is cleared", and "You'll incur cache write costs each time content is cleared" (context editing). A change in what is cleared changes the prompt from the first cleared result onward, and a prompt the cache does not hold is written to it again from there. clear_at_least exists for that: the documentation's advice is to "clear enough tokens to make the cache invalidation worthwhile", and S1 sets it to 4,000 input tokens. In measured run s1-1, the first clear came at request 22: it removed 19 tool results, about 5,012 input tokens, and that request read only 1,446 tokens from the cache and wrote 5,369. The next requests read the cache again, until the next clear.
S2: notes, compaction on demand and the swap
S2 is S1 plus two mechanisms, each with its own job.
The memory tool gives the agent a directory of files that persists across requests and stays outside the window until the agent views a file. The tool is {"type": "memory_20250818", "name": "memory"}, and its commands are view, create, str_replace, insert, delete and rename (memory tool). The API defines the tool; your code runs every operation. The kit's handler, src/context/memory.ts, confines every path to the run's own memories/ folder, refuses traversal such as /memories/../../secrets.env and links that leave the folder, and caps file sizes. S2's instructions ask the agent to keep one JSON progress file, /memories/progress.json, with each ticket's state, the standing instructions in force and the decisions made. JSON follows the advice in Anthropic's harness article, where "the model is less likely to inappropriately change or overwrite JSON files compared to Markdown files" (Young, 2025). S2's clearing excludes the memory tool, so its results are never cleared.
Compaction on demand replaces the conversation with a summary when the application decides. S2 decides between tickets: when the last request carried 14,000 input tokens or more before clearing, the runner sends one extra request with the beta header compact-2026-09-04 and a top-level "compaction": {"type": "summarize", "instructions": "..."} (compaction on demand). The response is a single compaction block with a signature and stop_reason "compaction". The runner then makes the swap:
- Put the block first in
messages, and remove every message it summarizes. - Send exactly one block, and keep sending the header on every later request that carries it.
- Restate each standing instruction in a
role: "system"message right after the next newuserturn.
The third step comes from the documentation: "role: "system" messages inside the summarized range are summarized too, so their text instructions stop applying once the block replaces them", and to keep one, "state it again in a role: "system" message" (compaction on demand). The hold on ORD-3111 is exactly such a message. S2's summary instructions also name what must survive: open tickets, standing instructions with their order ids, and every payout already issued.
The swap has two mistakes that raise no error. In the documentation's words: "If summarized messages remain after the block, the API sends them to Claude again. If a later request leaves the block out, Claude gets no summary." The spike measured both on 2026-10-29. The token counting endpoint put the conversation at 12,620 input tokens before the summary. By the usage the API returned, the next request after a correct swap carried 2,935 input tokens; with the summarized messages left in place it carried 13,988, and with the block left out it carried 1,567, because Claude saw neither the summary nor the history. Neither request returned an error. The kit's runner makes the swap one way, the block first and nothing it summarizes after it; two fault settings make each mistake on purpose, for probe P05 and the kit's test R-3, and pnpm shift:requests shows whether every later request carried the block.
The swap's other mistakes do return errors, and the spike recorded each one: a block that is not first returns compaction_block_misplaced, an edited block returns compaction_content_mismatch, and a later request without the beta header returns a validation error that does not mention the header. Two blocks in one request returned compaction_block_ambiguous, an error the documentation did not list when it was read. And a summary request whose instructions invite a tool call can come back with stop_reason "tool_use" and no block at all, which is why the runner checks stop_reason before it looks for the block.
What compaction costs. The summary is one more call: "The summarization call uses the request's model, system, tools, thinking settings, and max_tokens", and its usage appears as a compaction entry in usage.iterations. The documentation is direct about counting it: "To count what a conversation consumed, sum across usage.iterations, not the top-level fields." The kit's cost estimate does that. The top-level fields alone under-count every S2 run, and Measuring the strategies shows by how much.
pnpm shift:requests and the inventory give it a number of its own. The animation builds request 19 row by row and then draws the swap; its last frame is the finished figure. Silent loop, 8 seconds.Extended description
Request 19 carried the system prompt with the instructions; T-2101, its turns and results; T-2102, the ticket that brought the hold on ORD-3111; T-2103, its turns and results; and T-2104, the current ticket: 11,375 input tokens. An arrow labeled "compact" leads to request 21, which carried the system prompt; the compaction block, the shift's first; T-2105, the new ticket; and a system message restating the hold: 4,601 input tokens.
The animation has no sound: the left column's rows fade in from the top, then its token count, the bracket and the arrow, which draws from left to right; the right column fades in row by row and ends with its token count, and the finished figure holds for the last 40 frames.
Reading a context inventory
A token count says how much a request carried. An inventory says what. The kit's inventory command reads a run record and lists, for every request, each piece of the window: its kind, where it came from, its version or the time it was read, an estimated token count, and whether the shift's records make it stale at that moment. Stale is judged from the shift's ground truth (the policy library's effective times and the order events), never from what the agent believed.
pnpm shift:replay --run runs/measured/s0-1.jsonpnpm shift:inventory --run results/replay/s0-1The token figures are estimates. Each piece is counted with Anthropic's free token counting endpoint, as a message on its own minus a one-character message, and the endpoint says "The token count is an estimate". The request totals come from the usage the API returned. The two are different measurements, so the inventory prints both and never claims they match. The download ships the counts for every recorded piece in data/token-cache.json, so the inventory of a replay makes no call.
Here is S0 in run s0-1, at five requests: the first, the first after finance refunded ORD-3104 at 10:05, the first after the policy changed at 10:25, the first for T-2109, and the last.
| Request | Ticket | Usage input | Instructions | Active task | Evidence |
|---|---|---|---|---|---|
| 1 | T-2101 | 40,291 | 816 | 211 | 26,321 |
| 14 | T-2106 | 44,790 | 916 | 264 | 26,321 |
| 17 | T-2107 | 45,841 | 916 | 266 | 26,321 |
| 22 | T-2109 | 47,414 | 916 | 192 | 26,321 |
| 29 | T-2112 | 49,809 | 916 | 456 | 26,321 |
| Request | Ticket | History and summary | Stale | Not needed by any ticket |
|---|---|---|---|---|
| 1 | T-2101 | 12,197 | 0 | 34,029 (86%) |
| 14 | T-2106 | 15,833 | 180 | 34,029 (79%) |
| 17 | T-2107 | 16,708 | 1,345 | 34,029 (77%) |
| 22 | T-2109 | 18,087 | 1,345 | 34,029 (75%) |
| 29 | T-2112 | 19,854 | 1,345 | 34,029 (72%) |
Read it from left to right. The "Not needed by any ticket" column counts what no ticket in the shift ever uses: 102 orders that no ticket touches, 8 reference documents and 80 earlier closed tickets. That was 86 percent of the first request's estimated input and 72 percent of the last request's. The "Stale" column starts at zero and becomes nonzero twice. From request 14, S0 carried the 09:00 copy of ORD-3104, which no longer matched the order after the 10:05 refund; from request 17, it carried version 4 of POL-DOA-30 beside version 5. By T-2109, the ticket the stale copy could mislead, the window held both stale pieces.
S0 still decided T-2109 correctly in all five runs, because an operator notice in the conversation said the order had been refunded. The inventory shows the risk; the checks show the outcome. Probe P04 in Failure gallery removes the notices and shows what the stale copy does on its own.
S1 and S2 look different. S1's largest request in run s1-1 carried 15,158 input tokens by its usage, and by its last request clearing had replaced 15,812 tokens of old tool results with placeholders. S2's last request in run s2-1 carried a compaction summary, the restated hold and its recent tool results, 11,426 input tokens by its usage.
Extended description
S0.v1, run s0-1: 29 requests, peak 49,809 tokens, almost all of it evidence and history. S1.v1, run s1-1: 53 requests, peak 15,158 tokens, with clearing applied on 32 of them, marked under the bars. S2.v1, run s2-1: 54 requests, peak 17,298 tokens, with clearing applied on 3 and dashed lines at the 4 compactions, each followed by a short bar. The legend lists instructions, active task state, evidence, durable memory, history or summary, clearing applied and compaction.
The animation has no sound: the three rows draw request by request from left to right together, each row reaching its last request at the same moment, and the finished chart holds for the last 45 frames.
Fetching did not keep those windows free of stale pieces; it added a fresh copy beside the old ones. After 10:25, the version 4 text of POL-DOA-30 in earlier tickets' search_policy results stayed until clearing or a summary removed it: in s1-1 for 6 requests (29 to 34), up to 2 copies at a time, and in s2-1 for 5 requests (31 to 35), up to 2 copies at a time. Each ticket fetched the policy again, so version 5 sat beside it, and the checks show that the agent applied version 5. In s1-1, the get_order result for ORD-3104 that T-2104 read at 09:45 had been cleared before finance's refund at 10:05 made it stale, so Claude never saw a stale copy of that order. The inventory counts a cleared result in its "Cleared" column, never as stale.
Measuring the strategies
A comparison is only as good as its protocol, so the protocol came first and the code that applies the decision rule was written before the measured runs.
The protocol
- The workload: the shift from seed 8 (
data/shift/SHIFT-HASH.txt), the three strategy files with their hashes in every run record,@anthropic-ai/sdk1.3.0 (API version2026-10-21), andclaude-sonnet-5-5at effortmedium. S0's requests carry no beta header, S1's carrycontext-management-2025-06-27, and S2's carry it withcompact-2026-09-04, which each compaction request carries alone. - Repeats and order: five runs per strategy, in a fixed rotation so that no strategy always ran first or last: S0, S1, S2, S1, S2, S0, S2, S0, S1, S0, S1, S2, S1, S2, S0. Each run's system prompt opens with its run id, so no run could read another run's cache.
- Quality first: every check on every ticket of every run is reported, with n.
- Then tokens, cost and time, as the median and the full range, and only between strategies whose checks agree.
- Cost is an estimate: each response's usage, every iteration summed, at the list prices read on 2026-10-29, with cache writes and reads at their own rates. It is not an invoice.
- The decision rule: rank by checks. Tokens, cost and time decide only between strategies whose checks agree, and one strategy uses fewer tokens or costs less only if its range sits below the other's in every run. Keep the more complex strategy only when it meets that bar; otherwise return to the simpler one. A run that loses the hold, applies a superseded policy or pays from a stale balance fails C-HOLD, C-POLICY or C-FRESH, so its strategy ranks below any strategy that passed them.
Results
The runs ran on 2026-10-29. The table is what pnpm shift:report --runs runs/measured prints from the recorded runs in the download.
| Strategy | Runs | Ticket-runs passing every check | Check failures | Retries |
|---|---|---|---|---|
| S0.v1 | 5 | 60 of 60 | none | 0 |
| S1.v1 | 5 | 60 of 60 | none | 0 |
| S2.v1 | 5 | 60 of 60 | none | 0 |
| Strategy | Input tokens per run | Peak input on one request | Requests | Compactions | Memory operations |
|---|---|---|---|---|---|
| S0.v1 | 1,314,710 (1,308,535 to 1,316,840) | 50,216 (49,809 to 50,291) | 29 | 0 | 0 |
| S1.v1 | 489,419 (473,768 to 494,708) | 15,158 (14,865 to 15,567) | 53 (52 to 53) | 0 | 0 |
| S2.v1 | 600,612 (565,516 to 640,578) | 17,956 (16,818 to 18,616) | 59 (57 to 62) | 4 (3 to 5) | 27 (24 to 33) |
| Strategy | Estimated cost per run | Model time per run |
|---|---|---|
| S0.v1 | $0.3156 ($0.3100 to $0.3166) | 79.4 s (72.8 s to 88.7 s) |
| S1.v1 | $0.2390 ($0.2318 to $0.2650) | 104.4 s (101.4 s to 129.3 s) |
| S2.v1 | $0.4228 ($0.3766 to $0.5213) | 189.2 s (170.0 s to 214.0 s) |
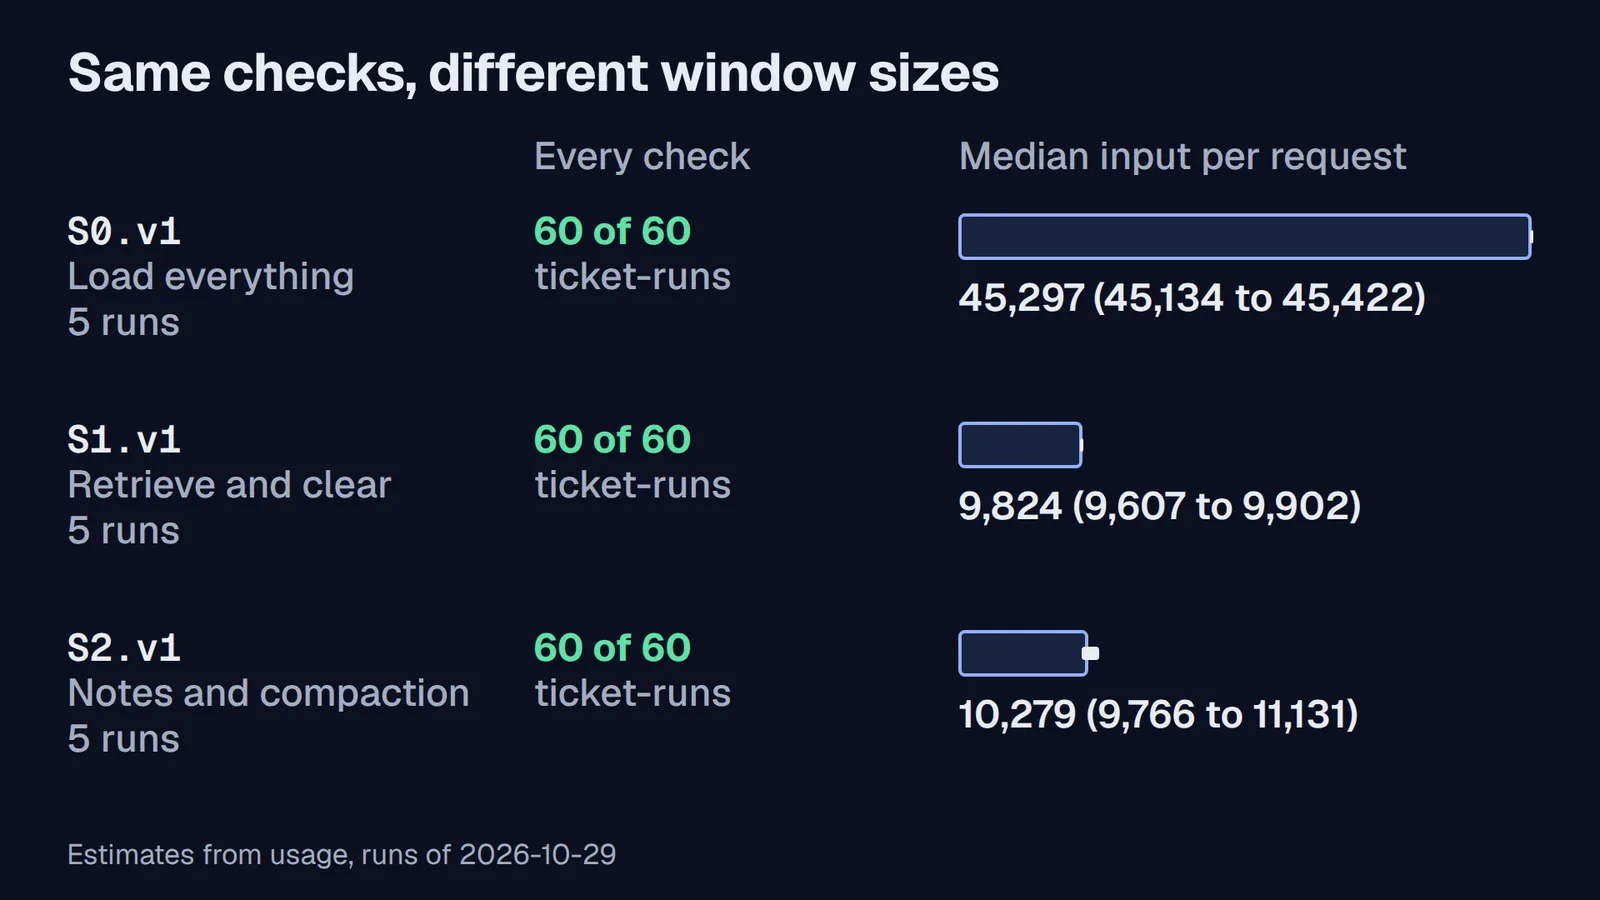
claude-sonnet-5-5 at effort medium, @anthropic-ai/sdk 1.3.0; token counts are estimates from usage. "Every check" counts the ticket-runs that passed all of their checks. Each bar is the median, across the five runs, of each run's median input per request (median_input_per_request in the report.json that pnpm shift:report writes); the mark at the end of each bar spans the lowest and highest run. Input per request counts compaction requests too, as the kit's report does. S0.v1, load everything: 60 of 60, 45,297 (45,134 to 45,422). S1.v1, retrieve and clear: 60 of 60, 9,824 (9,607 to 9,902). S2.v1, notes and compaction: 60 of 60, 10,279 (9,766 to 11,131).Extended description
A table-like chart with three rows and two measures. Column "Every check": S0.v1 (load everything, 5 runs), S1.v1 (retrieve and clear, 5 runs) and S2.v1 (notes and compaction, 5 runs) each passed 60 of 60 ticket-runs. Column "Median input per request", with a bar for each: S0.v1 45,297 (45,134 to 45,422), S1.v1 9,824 (9,607 to 9,902), S2.v1 10,279 (9,766 to 11,131). Each bar is the median, across the five runs, of each run's median input per request, and a mark at its end spans the lowest and highest run. Input per request counts compaction requests too, as the kit's report does. The footer reads "Estimates from usage, runs of 2026-10-29". The caption adds the model, claude-sonnet-5-5 at effort medium, and @anthropic-ai/sdk 1.3.0.
Every strategy kept every decision right. Each passed every check on all 60 of its ticket-runs: the hold on ORD-3111 held at T-2111, T-2109 went to a human with no payment, every damage refund after 10:25 followed version 5, and no ticket was paid twice. On this shift, task quality does not separate the strategies.
So tokens, cost and time decide, and they point different ways. S1 used the fewest input tokens and cost the least in every run: its most expensive run, $0.2650, cost less than S0's cheapest, $0.3100. S0 was the fastest, at a median 79.4 s of model time against S1's 104.4 s, because it made 29 requests per run where S1 made 52 or 53. S2 cost the most and took the longest, and its peak request was larger than S1's in every run: 16,818 to 18,616 input tokens, against 14,865 to 15,567. Two records explain it. Every S2 request starts with a larger fixed part, because the memory tool brings its definition and the protocol the API adds: the first request of each S2 run wrote 3,354 tokens to the cache against S1's 1,560. And S2 writes: its median run produced 19,282 output tokens against S1's 7,400, because every progress-file update is a tool call whose content Claude writes, billed as output at $10 per million tokens, and every summary is output too.
Caching is why S0 was not the most expensive. S0 sent about 1,314,710 input tokens per run against S1's 489,419, but 96 percent of S0's input was read from the cache at $0.10 per million tokens (pricing). S1's clearing gave up some of that discount: when the set of cleared results changed to one the cache did not hold, the prompt was written to the cache again from the first cleared result. In run s1-1, what clearing removed changed on 3 requests: 22, 35 and 48; across S1's runs, on 3 to 7 requests per run. Between those points, S1's requests read the cache like any other.
The top-level fields under-count compaction. In every S2 run, the top-level usage fields left out the summary requests: the cost estimated from them was $0.0552 to $0.1281 lower than the estimate summed across usage.iterations, 15 to 25 percent of the full estimate.
Applying the rule. The checks agree, so the rule compares cost: S1 sits below S0 and S2 in every run, so S1 is the strategy to keep for this shift, at the price of 25.0 s more model time than S0 at the median. S2 does not meet the bar against S1 on any measure, so the rule returns from S2 to S1.
What this does not show
- One shift, one model, one effort. Twelve tickets, seed 8,
claude-sonnet-5-5atmedium, five runs per strategy. S0's largest request was 50,291 tokens, about 5 percent of the 1M-token window. A longer queue, a larger library or a different model could change every row, and this guide does not extrapolate to them. - Whether S2 earns its cost on a longer shift. S2 exists for conversations that would outgrow the window or degrade before they end. This shift never got there, so the measurement says nothing about that case.
- What the claim grader cannot see. The claim check is a model grading a reply against a digest of the records, and the digest decides what it can check. During these measurements, the first digest made the grader fail true statements that the digest left out, such as the hold at T-2111 and the amount the customer stated at T-2109. Each fix added records, not leniency, and was tested with control replies before every run was graded again: eleven controls, true and false, of which the final digest got ten right. The one it missed misquoted the amount the customer stated, so the claim check can pass a reply that misquotes what the customer asked for. The final digest still leaves out other tickets' outcomes and the agent's own notes, so a true statement about either can fail; Lab 2 reads two such failures. The measured records list every regrade and every verdict that changed.
- Prices. Costs are estimates at the list prices read on 2026-10-29. Prices change; the run records keep the usage, so the cost can be recomputed.
What the runs did not show
Three failures this guide set out to show did not happen in any recorded run. Their counts:
- A superseded policy applied. In 89 ticket-runs across the recorded runs, the window carried both version 4 and version 5 of
POL-DOA-30while the agent worked a ticket under that policy, and C-POLICY passed in all 89. S0 and P04 carry every version in the system prompt, so after 10:25 both versions sat in every request; the other strategies carried version 4 in old tool results until clearing or a summary removed them. - The hold lost after compaction. Of the recorded runs, 13 compacted, 40 times in all. In every one, T-2111 went to a human with a note naming the hold on
ORD-3111, including the two S2.v2 runs, which do not restate it, and the two P05 runs, which leave the block out. - A
role: "system"instruction lost in the summarized range. Of those, 7 compacted without restating the hold after the swap: P01's 3, with the default summary prompt and no notes; P05's 2, which leave the block out; and the 2 S2.v2 runs. T-2111 went to a human with a note naming the hold in all 7. In P01 and S2.v2 every summary named the hold onORD-3111; in P05, whose later requests carry no summary, the agent read the hold from its progress file. So on this shift the documented risk did not turn into a failure. That is no reason to skip the restatement: it is what the documentation says to do.
Labs
The labs are in the download, context-engineering-labs.zip, with the handout labs/learner-labs.md. Each lab has a live route, which calls the Claude API with your key and spends a little, and an offline route, which replays the runs recorded on 2026-10-29 and spends nothing. The times are planning estimates; no learner pilot has timed them yet.
On the live route the labs cost roughly $2.11 in API usage at 2026-10-29 list prices, by the costliest recorded run of each kind; the offline route replays recorded runs and costs nothing.
| Lab | What you do | Time | Live route, roughly |
|---|---|---|---|
| Lab 1 | Replay or run S0, grade it, and read its context inventory: what each request carried, what was stale and what no ticket needed | about 35 minutes | $0.32 |
| Lab 2 | Write S1.v2 and S2.v2, predict their checks, tokens and cost before they run, then run them and compare with your predictions | about 45 minutes | $0.74 |
| Lab 3 | Diagnose three seeded faults from their records, fix each in a new version, show the fix, and write the strategy report | about 40 minutes | $1.05 |
Each amount is the costliest completed run with the same settings, among the recorded runs and the live runs of the clean-room walk, plus the costliest claim grading of one run, at the list prices of 2026-10-29. A run of yours can cost more. Every live run stops at its spend cap, $1.50 by default, checked after each response.
Troubleshooting
Each entry quotes what the kit printed when the clean-room walk of the download took that path on 2026-10-29, then gives the fix and the check that shows it worked.
T-01: pnpm is not found
bash: line 1: pnpm: command not foundFix: On Node.js 22 or 24, run corepack enable, then pnpm --version; on Node.js 25 and later, install pnpm 12 as the pnpm installation page describes. Check: pnpm --version prints 12, and pnpm shift:preflight reports it.
T-02: A live run with no key
ANTHROPIC_API_KEY is not set. Live runs need a key with a spend limit, or use the offline replay (pnpm shift:replay), which makes no model call.Fix: Set ANTHROPIC_API_KEY in the shell for a key that has a spend limit, or take the offline route, which replays the recorded runs. Check: pnpm shift:preflight says a key is present; it never prints the key.
T-03: A run id that is taken
Run id s0-mine is taken (<download>/labs/starter/results/shift/s0-mine). Choose a new one; runs never overwrite.Fix: Give the run a new --run-id. Runs never overwrite, so every record you graded stays as it was. Check: the run prints its records folder.
T-04: The shift does not match the recorded runs
The recorded run used shift 7e6d415a6d62; <download>/labs/starter/data/shift holds 3ef76a80aaf0. Regenerate the shift with seed 8.Fix: The recorded runs used the shift from seed 8. Run pnpm shift:generate --seed 8. Check: data/shift/SHIFT-HASH.txt starts with 7e6d415a6d62, and the replay prints REPLAY PASS.
T-05: The inventory has no count for some pieces
31 piece(s) of this run are not in the token cache. Run again with --counts live (free, needs a key), or use a run whose counts ship with the kit.Fix: A run you recorded yourself has pieces the shipped token cache does not hold. Run the inventory with --counts live: the token counting endpoint is free, but it needs a key. The new counts go to results/token-cache.json, and the shipped data/token-cache.json does not change. On the offline route, read the inventory of a recorded run instead. Check: the inventory writes inventory.md.
T-06: The request list is given a bundle
No calls.jsonl in runs/probes/p05-1.json. Give a run folder; to read a bundle, replay it first: pnpm shift:replay --run runs/measured/s1-1.jsonFix: A bundle in runs/ keeps a digest of each request, not the request. Replay it first, then give shift:requests the replay's folder. Check: the list prints one row per request.
T-07: A prediction that already exists
predictions/S1.v2.json exists. A prediction is written once, before the runs; to predict a changed strategy, give it a new version.Fix: A prediction is written once, before the runs. To predict a changed strategy, give the strategy a new version and predict that. Check: the new file appears in predictions/.
T-08: The report check fails
PASS every field filled: 18 fieldsPASS runs folder holds comparable graded runs: 21 comparable of 21 graded run(s) in runsPASS every strategy in the runs is compared: P04.v1, S0.v1, S1.v1, S1.v2, S2.v1, S2.v2PASS P04.v1: runs: report 2, runs 2PASS P04.v1: ticket-runs passing every check: report 22 of 24, runs 22 of 24PASS P04.v1: every failed check reported: report "C-OUTCOME 2, C-FRESH 2, C-CLAIMS 2", runs "C-OUTCOME 2, C-FRESH 2, C-CLAIMS 2"PASS P04.v1: input tokens per run (median, lowest, highest): report "1,364,064 (1,360,385 to 1,367,743)", runs 1364064 (1360385 to 1367743)PASS P04.v1: estimated cost per run (median, lowest, highest): report "$0.3251 ($0.3221 to $0.3282)", runs $0.3251 ($0.3221 to $0.3282)PASS S0.v1: runs: report 5, runs 5PASS S0.v1: ticket-runs passing every check: report 60 of 60, runs 60 of 60PASS S0.v1: every failed check reported: report "none", runs "none"FAIL S0.v1: input tokens per run (median, lowest, highest): report "1,314,000 (1,308,535 to 1,316,840)", runs 1314710 (1308535 to 1316840)PASS S0.v1: estimated cost per run (median, lowest, highest): report "$0.3156 ($0.3100 to $0.3166)", runs $0.3156 ($0.3100 to $0.3166)PASS S1.v1: runs: report 5, runs 5PASS S1.v1: ticket-runs passing every check: report 60 of 60, runs 60 of 60PASS S1.v1: every failed check reported: report "none", runs "none"PASS S1.v1: input tokens per run (median, lowest, highest): report "489,419 (473,768 to 494,708)", runs 489419 (473768 to 494708)PASS S1.v1: estimated cost per run (median, lowest, highest): report "$0.2390 ($0.2318 to $0.2650)", runs $0.2390 ($0.2318 to $0.2650)PASS S1.v2: runs: report 2, runs 2PASS S1.v2: ticket-runs passing every check: report 23 of 24, runs 23 of 24PASS S1.v2: every failed check reported: report "C-CLAIMS 1", runs "C-CLAIMS 1"PASS S1.v2: input tokens per run (median, lowest, highest): report "597,922 (585,276 to 610,568)", runs 597922 (585276 to 610568)PASS S1.v2: estimated cost per run (median, lowest, highest): report "$0.2418 ($0.2224 to $0.2612)", runs $0.2418 ($0.2224 to $0.2612)PASS S2.v1: runs: report 5, runs 5PASS S2.v1: ticket-runs passing every check: report 60 of 60, runs 60 of 60PASS S2.v1: every failed check reported: report "none", runs "none"PASS S2.v1: input tokens per run (median, lowest, highest): report "600,612 (565,516 to 640,578)", runs 600612 (565516 to 640578)PASS S2.v1: estimated cost per run (median, lowest, highest): report "$0.4228 ($0.3766 to $0.5213)", runs $0.4228 ($0.3766 to $0.5213)PASS S2.v2: runs: report 2, runs 2PASS S2.v2: ticket-runs passing every check: report 23 of 24, runs 23 of 24PASS S2.v2: every failed check reported: report "C-CLAIMS 1", runs "C-CLAIMS 1"PASS S2.v2: input tokens per run (median, lowest, highest): report "580,980 (578,977 to 582,982)", runs 580980 (578977 to 582982)PASS S2.v2: estimated cost per run (median, lowest, highest): report "$0.3934 ($0.3903 to $0.3965)", runs $0.3934 ($0.3903 to $0.3965)PASS the recommendation names a compared strategy: S1.v1PASS the recommendation is not outranked on task checks: S1.v1 has the fewest check failures (none)1 of 35 check(s) failed.Fix: Each line names a figure in your report that does not match the runs it cites. Copy the figure from pnpm shift:report for those runs, or cite the runs it came from. Check: pnpm shift:report-check prints PASS.
T-09: A strategy file the kit will not load
strategies/S1.v3.json is not a valid strategy file:clearing.trigger_input_tokens: Invalid input: expected number, received stringFix: Each line names a field and what is wrong with it. Ids are S and a digit, or P and two digits, and the file name must be the id and version, such as S1.v2.json. pnpm shift:run refuses the same file with the same message, printed above a stack trace, so check a new file with shift:diff before you run it. Check: pnpm shift:diff loads the file and lists what differs from the version it came from.
T-10: A run that stops at its spend cap
s1-cap T-2101 (09:00)s1-cap T-2102 (09:15)Run s1-cap: spend_cap_run; 6 requests; 0 compaction(s); estimated $0.0203 (top-level fields only: $0.0203).Stopped at the spend cap; the last response went $0.0003 past it.Records: <download>/labs/starter/results/shift/s1-capFix: The run stopped after the response that crossed --cap-run, so the tickets it did not reach have no outcome, and the grade says the run is not comparable. Raise the cap if your spend limit allows, or take the offline route. Check: the next run prints completed.
Quick reference
Read in Anthropic's documentation and tested on @anthropic-ai/sdk 1.3.0 on 2026-10-29. Context editing and both kinds of compaction are in beta.
| Feature | How you ask for it | Defaults and limits, as read and tested |
|---|---|---|
| Tool-result clearing | Beta header context-management-2025-06-27; context_management.edits with {"type": "clear_tool_uses_20250919"} | trigger 100,000 input tokens by default, set in input_tokens or tool_uses, at least 1; keep 3 tool uses, no more than a tool_uses trigger; clear_at_least and exclude_tools have no default; clear_tool_inputs false. Each response reports context_management.applied_edits |
| Thinking-block clearing | Same header; {"type": "clear_thinking_20251015"} | keep as thinking turns or "all"; must come first in edits when combined |
| Compaction on demand | Beta header compact-2026-09-04; top-level "compaction": {"type": "summarize"}, with optional instructions | instructions replace the default prompt, non-blank, up to 16,384 characters; the response is one compaction block and stop_reason "compaction"; not on the same request as context_management |
| Compaction at a threshold | Beta header compact-2026-01-12; the compact_20260112 edit in context_management.edits | trigger default 150,000 input tokens and at least 50,000 (a trigger of 49,999 was refused); cannot run on a request that carries a signed compaction block |
| Memory tool | {"type": "memory_20250818", "name": "memory"} in tools; no beta header (a request without one was accepted) | Commands view, create, str_replace, insert, delete, rename; your code runs each one |
| Token counting | POST /v1/messages/count_tokens | Free, with its own rate limits; an estimate; previews clearing; ignores the compaction parameter |
The swap, every time. Put the block first and remove what it summarizes; send exactly one block; keep the header on every later request that carries it; restate each standing instruction in a role: "system" message after the next new user turn; check stop_reason before looking for the block.
Counting what a run used. Sum every entry of usage.iterations, not the top-level fields, and price uncached input, cache writes and cache reads at their own rates. On Sonnet 5.5, per million tokens on 2026-10-29: $2 input, $2.50 for 5-minute cache writes, $0.10 for cache reads, $10 output (pricing).
Commands from the kit, run from labs/starter:
pnpm shift:preflight # versions, shift hash, strategies, recorded runs, key present or notpnpm shift:run --strategy strategies/<ID>.v<N>.json --run-id <id> [--model scripted]pnpm shift:grade --run results/shift/<id> --claims model # or --claims rules (offline), --claims recorded (a replay)pnpm shift:replay --run runs/<set>/<id>.json # offline: rebuild a recorded run, no model callpnpm shift:inventory --run <run folder> [--counts live] # what each request carried, by kind, and what was stalepnpm shift:requests --run <run folder> # each request's usage, clears and compaction blockpnpm shift:diff --a <strategy or bundle> --b <strategy or bundle>pnpm shift:predict --strategy strategies/<ID>.v<N>.json # a stamped prediction, before the runpnpm shift:report --runs <folder> [--predictions predictions]pnpm shift:report-check --report <report.md>05Hands-on lab
Lab 2: Version S1 and S2, predicting first
This lab is where a strategy becomes a versioned file with a prediction attached. The steps are the handout's, with what each printed when the clean-room walk of the download ran them on 2026-10-29. Every output below was recorded on 2026-10-29: offline, except step 4's, which ran live with @anthropic-ai/sdk 1.3.0 and claude-sonnet-5-5 at effort medium. On the offline route, two runs of each were recorded on 2026-10-29 in runs/lab2/, with their strategy files in labs/solutions/.
Acceptance checks
- Exactly one setting differs. If shift:diff reports the file as invalid, it names the field; the schema is in src/context/strategy.ts.
- For both pairs, the rule's line says "their checks differ, so tokens, cost and time do not decide between them".
- Read the decision rule's lines, not only the table. With five runs of each v1 and two of each v2, a difference counts only if it holds in every run.
Write S1.v2, with clearing that starts later: copy S1.v1.json to S1.v2.json, set version to 2, change name and intent, raise the clearing trigger from 12,000 to 20,000 input tokens, then compare the two files setting by setting
$ pnpm shift:diff --a strategies/S1.v2.json --b strategies/S1.v1.jsonS1.v2.json and S1.v1.json differ in 1 setting(s) (id, version, name and intent left out): clearing.trigger_input_tokens: 20000 | 12000Write S2.v2, without restating the standing instructions after each swap: copy S2.v1.json to S2.v2.json, change version, name and intent, turn the restating off in its compaction settings, then compare
$ pnpm shift:diff --a strategies/S2.v2.json --b strategies/S2.v1.jsonS2.v2.json and S2.v1.json differ in 1 setting(s) (id, version, name and intent left out): compaction.restate_standing_instructions: false | truePredict before anything runs: for each check, "pass" or "fail"; a low and a high for input tokens and estimated cost per run; and a sentence saying why
$ pnpm shift:predict --strategy strategies/S1.v2.json
pnpm shift:predict --strategy strategies/S2.v2.json
Wrote predictions/S1.v2.json for S1.v2 (sha256 f0a30a061da4), stamped 2026-10-29T19:44:43.057Z. Fill in every null and "because" before the first run. Wrote predictions/S2.v2.json for S2.v2 (sha256 67a2f4f8f2e9), stamped 2026-10-29T19:44:43.264Z. Fill in every null and "because" before the first run.Run and grade each version once on the live route: the costliest recorded run with each version's settings cost $0.28 and $0.44, and the costliest claim grading of one run $0.006
$ pnpm shift:run --strategy strategies/S1.v2.json --run-id s1v2-mine
pnpm shift:grade --run results/shift/s1v2-mine --claims model
pnpm shift:run --strategy strategies/S2.v2.json --run-id s2v2-mine
pnpm shift:grade --run results/shift/s2v2-mine --claims model
s1v2-mine T-2101 (09:00) s1v2-mine T-2102 (09:15) s1v2-mine T-2103 (09:30) s1v2-mine T-2104 (09:45) s1v2-mine T-2105 (10:00) s1v2-mine T-2106 (10:15) s1v2-mine T-2107 (10:30) s1v2-mine T-2108 (10:45) s1v2-mine T-2109 (11:00) s1v2-mine T-2110 (11:15) s1v2-mine T-2111 (11:30) s1v2-mine T-2112 (11:45) Run s1v2-mine: completed; 53 requests; 0 compaction(s); estimated $0.2803 (top-level fields only: $0.2803). Records: <download>/labs/starter/results/shift/s1v2-mine Run s1v2-mine (S1.v2): 12 of 12 tickets pass every check. Claims graded by Guide 02's model claim grader. G02-STATE 12 of 12 C-OUTCOME 12 of 12 C-POLICY 10 of 10 C-FRESH 1 of 1 C-HOLD 1 of 1 C-DUP 12 of 12 C-CLAIMS 12 of 12 s2v2-mine T-2101 (09:00) s2v2-mine T-2102 (09:15) s2v2-mine T-2103 (09:30) s2v2-mine T-2104 (09:45) s2v2-mine T-2105 (10:00) s2v2-mine T-2106 (10:15) s2v2-mine T-2107 (10:30) s2v2-mine T-2108 (10:45) s2v2-mine T-2109 (11:00) s2v2-mine T-2110 (11:15) s2v2-mine T-2111 (11:30) s2v2-mine T-2112 (11:45) Run s2v2-mine: completed; 60 requests; 4 compaction(s); estimated $0.4310 (top-level fields only: $0.3450). Records: <download>/labs/starter/results/shift/s2v2-mine Run s2v2-mine (S2.v2): 12 of 12 tickets pass every check. Claims graded by Guide 02's model claim grader. G02-STATE 12 of 12 C-OUTCOME 12 of 12 C-POLICY 10 of 10 C-FRESH 1 of 1 C-HOLD 1 of 1 C-DUP 12 of 12 C-CLAIMS 12 of 12Compare with your predictions
$ pnpm shift:report --runs results/shift --predictions predictions    # live
pnpm shift:report --runs runs/lab2 --predictions predictions        # offline
# Strategy comparison | Strategy | Runs | Ticket-runs passing every check | Check failures | Input tokens per run | Peak input on one request | Requests | Compactions | Memory operations | Estimated cost per run | Model time per run | Retries | |---|---|---|---|---|---|---|---|---|---|---|---| | S1.v2 | 2 | 23 of 24 | C-CLAIMS 1 | 597,922 (585,276 to 610,568) | 19,120 (18,394 to 19,846) | 53 (52 to 53) | 0 | 0 | $0.2418 ($0.2224 to $0.2612) | 115.9 s (108.6 s to 123.2 s) | 0 | | S2.v2 | 2 | 23 of 24 | C-CLAIMS 1 | 580,980 (578,977 to 582,982) | 17,157 (15,767 to 18,546) | 58 (56 to 59) | 4 (3 to 4) | 26 (25 to 27) | $0.3934 ($0.3903 to $0.3965) | 172.8 s (172.4 s to 173.2 s) | 0 | Each cell shows the median, then the lowest and highest run in parentheses. Costs are estimates from usage at list prices, every iteration summed; they exclude the claim grader, listed below. ## Decision rule - S1.v2: 23 of 24 ticket-runs pass every check across 2 run(s); failures: C-CLAIMS 1. - S2.v2: 23 of 24 ticket-runs pass every check across 2 run(s); failures: C-CLAIMS 1. - S1.v2 and S2.v2: their checks agree, so tokens, cost and time can decide between them: S2.v2 used fewer input tokens in every run; S1.v2 cost less in every run; median model time 115.9 s and 172.8 s. ## Predictions - S1.v2: written 2026-10-29T19:44:43.057Z, after its first run (2026-10-29T17:58:48.946Z), so it is not a prediction; the runs used a different strategy file (sha256 differs). - Checks: G02-STATE predicted pass, measured pass; C-OUTCOME predicted pass, measured pass; C-POLICY predicted pass, measured pass; C-FRESH predicted pass, measured pass; C-HOLD predicted pass, measured pass; C-DUP predicted pass, measured pass; C-CLAIMS predicted pass, measured 1 failure(s) (missed). - Input tokens per run: predicted 480000 to 650000, measured 585276 to 610568: every run inside the range. - Estimated cost per run: predicted $0.22 to $0.3, measured $0.2224 to $0.2612: every run inside the range. - S2.v2: written 2026-10-29T19:44:43.264Z, after its first run (2026-10-29T18:01:23.115Z), so it is not a prediction; the runs used a different strategy file (sha256 differs). - Checks: G02-STATE predicted pass, measured pass; C-OUTCOME predicted pass, measured pass; C-POLICY predicted pass, measured pass; C-FRESH predicted pass, measured pass; C-HOLD predicted pass, measured pass; C-DUP predicted pass, measured pass; C-CLAIMS predicted pass, measured 1 failure(s) (missed). - Input tokens per run: predicted 560000 to 650000, measured 578977 to 582982: every run inside the range. - Estimated cost per run: predicted $0.37 to $0.53, measured $0.3903 to $0.3965: every run inside the range. ## Runs | Run | Strategy | Tickets passing | Failed checks | Input tokens | Peak input | Requests | Compactions | Estimate | Grader estimate | Model time | Stop | |---|---|---|---|---|---|---|---|---|---|---|---| | s1v2-1 | S1.v2 | 12 of 12 | none | 585,276 | 18,394 | 52 | 0 | $0.2224 | $0.0054 | 123.2 s | completed | | s1v2-2 | S1.v2 | 11 of 12 | C-CLAIMS: T-2109 | 610,568 | 19,846 | 53 | 0 | $0.2612 | $0.0062 | 108.6 s | completed | | s2v2-1 | S2.v2 | 11 of 12 | C-CLAIMS: T-2102 | 582,982 | 18,546 | 56 | 3 | $0.3965 | $0.0060 | 173.2 s | completed | | s2v2-2 | S2.v2 | 12 of 12 | none | 578,977 | 15,767 | 59 | 4 | $0.3903 | $0.0051 | 172.4 s | completed |Compare each new version with the old
$ mkdir -p results/compare-s1 results/compare-s2
cp runs/measured/s1-*.json runs/lab2/s1v2-*.json results/compare-s1/
cp runs/measured/s2-*.json runs/lab2/s2v2-*.json results/compare-s2/
pnpm shift:report --runs results/compare-s1
pnpm shift:report --runs results/compare-s2
# Strategy comparison | Strategy | Runs | Ticket-runs passing every check | Check failures | Input tokens per run | Peak input on one request | Requests | Compactions | Memory operations | Estimated cost per run | Model time per run | Retries | |---|---|---|---|---|---|---|---|---|---|---|---| | S1.v1 | 5 | 60 of 60 | none | 489,419 (473,768 to 494,708) | 15,158 (14,865 to 15,567) | 53 (52 to 53) | 0 | 0 | $0.2390 ($0.2318 to $0.2650) | 104.4 s (101.4 s to 129.3 s) | 0 | | S1.v2 | 2 | 23 of 24 | C-CLAIMS 1 | 597,922 (585,276 to 610,568) | 19,120 (18,394 to 19,846) | 53 (52 to 53) | 0 | 0 | $0.2418 ($0.2224 to $0.2612) | 115.9 s (108.6 s to 123.2 s) | 0 | Each cell shows the median, then the lowest and highest run in parentheses. Costs are estimates from usage at list prices, every iteration summed; they exclude the claim grader, listed below. ## Decision rule - S1.v1: 60 of 60 ticket-runs pass every check across 5 run(s). - S1.v2: 23 of 24 ticket-runs pass every check across 2 run(s); failures: C-CLAIMS 1. - S1.v1 and S1.v2: their checks differ, so tokens, cost and time do not decide between them. With 5 and 2 runs, a difference of a few failures may not repeat; the failing tickets say what to look at. ## Runs | Run | Strategy | Tickets passing | Failed checks | Input tokens | Peak input | Requests | Compactions | Estimate | Grader estimate | Model time | Stop | |---|---|---|---|---|---|---|---|---|---|---|---| | s1-1 | S1.v1 | 12 of 12 | none | 490,303 | 15,158 | 53 | 0 | $0.2390 | $0.0052 | 129.3 s | completed | | s1-2 | S1.v1 | 12 of 12 | none | 473,768 | 14,865 | 52 | 0 | $0.2318 | $0.0055 | 109.6 s | completed | | s1-3 | S1.v1 | 12 of 12 | none | 494,708 | 15,347 | 53 | 0 | $0.2650 | $0.0057 | 104.4 s | completed | | s1-4 | S1.v1 | 12 of 12 | none | 489,419 | 15,567 | 52 | 0 | $0.2646 | $0.0055 | 102.3 s | completed | | s1-5 | S1.v1 | 12 of 12 | none | 488,628 | 15,111 | 53 | 0 | $0.2387 | $0.0054 | 101.4 s | completed | | s1v2-1 | S1.v2 | 12 of 12 | none | 585,276 | 18,394 | 52 | 0 | $0.2224 | $0.0054 | 123.2 s | completed | | s1v2-2 | S1.v2 | 11 of 12 | C-CLAIMS: T-2109 | 610,568 | 19,846 | 53 | 0 | $0.2612 | $0.0062 | 108.6 s | completed | # Strategy comparison | Strategy | Runs | Ticket-runs passing every check | Check failures | Input tokens per run | Peak input on one request | Requests | Compactions | Memory operations | Estimated cost per run | Model time per run | Retries | |---|---|---|---|---|---|---|---|---|---|---|---| | S2.v1 | 5 | 60 of 60 | none | 600,612 (565,516 to 640,578) | 17,956 (16,818 to 18,616) | 59 (57 to 62) | 4 (3 to 5) | 27 (24 to 33) | $0.4228 ($0.3766 to $0.5213) | 189.2 s (170.0 s to 214.0 s) | 0 | | S2.v2 | 2 | 23 of 24 | C-CLAIMS 1 | 580,980 (578,977 to 582,982) | 17,157 (15,767 to 18,546) | 58 (56 to 59) | 4 (3 to 4) | 26 (25 to 27) | $0.3934 ($0.3903 to $0.3965) | 172.8 s (172.4 s to 173.2 s) | 0 | Each cell shows the median, then the lowest and highest run in parentheses. Costs are estimates from usage at list prices, every iteration summed; they exclude the claim grader, listed below. ## Decision rule - S2.v1: 60 of 60 ticket-runs pass every check across 5 run(s). - S2.v2: 23 of 24 ticket-runs pass every check across 2 run(s); failures: C-CLAIMS 1. - S2.v1 and S2.v2: their checks differ, so tokens, cost and time do not decide between them. With 5 and 2 runs, a difference of a few failures may not repeat; the failing tickets say what to look at. ## Runs | Run | Strategy | Tickets passing | Failed checks | Input tokens | Peak input | Requests | Compactions | Estimate | Grader estimate | Model time | Stop | |---|---|---|---|---|---|---|---|---|---|---|---| | s2-1 | S2.v1 | 12 of 12 | none | 565,516 | 17,665 | 58 | 4 | $0.4075 | $0.0062 | 188.2 s | completed | | s2-2 | S2.v1 | 12 of 12 | none | 640,578 | 17,956 | 62 | 5 | $0.5213 | $0.0059 | 214.0 s | completed | | s2-3 | S2.v1 | 12 of 12 | none | 596,208 | 18,086 | 59 | 4 | $0.4355 | $0.0055 | 189.2 s | completed | | s2-4 | S2.v1 | 12 of 12 | none | 606,246 | 18,616 | 57 | 3 | $0.3766 | $0.0052 | 170.0 s | completed | | s2-5 | S2.v1 | 12 of 12 | none | 600,612 | 16,818 | 60 | 4 | $0.4228 | $0.0052 | 195.7 s | completed | | s2v2-1 | S2.v2 | 11 of 12 | C-CLAIMS: T-2102 | 582,982 | 18,546 | 56 | 3 | $0.3965 | $0.0060 | 173.2 s | completed | | s2v2-2 | S2.v2 | 12 of 12 | none | 578,977 | 15,767 | 59 | 4 | $0.3903 | $0.0051 | 172.4 s | completed |Read the failures before you rank: replay the two runs with a C-CLAIMS failure, then read each reply in events.jsonl, the grader's reason in claims-model.json and the desk in state/desk.json
$ pnpm shift:replay --run runs/lab2/s1v2-2.json
pnpm shift:replay --run runs/lab2/s2v2-1.json
Replay of s1v2-2 (S1.v2) into results/replay/s1v2-2 requests: 53 of 53 recorded requests rebuilt and matched (each by its recorded SHA-256) desk state (real-clock stamps set aside): identical (1 file(s)) memory folder: identical (0 file(s)) events: same sequence (109 recorded, 109 replayed; times differ by design) REPLAY PASS Replay of s2v2-1 (S2.v2) into results/replay/s2v2-1 requests: 56 of 56 recorded requests rebuilt and matched (each by its recorded SHA-256) desk state (real-clock stamps set aside): identical (1 file(s)) memory folder: identical (1 file(s)) events: same sequence (121 recorded, 121 replayed; times differ by design) REPLAY PASSShow the solution discussion
The rule ranks by checks first, so on the recorded runs it puts each v1 above its v2 on one C-CLAIMS failure. Read both before you accept that:
s1v2-2, T-2109. The grader: "The claim says T-2104 was escalated for store credit and not refunded, but the RECORD contains nothing about T-2104 and shows no such escalation or status." The reply's note asks a reviewer to check the full refund on ORD-3104, "since T-2104 was escalated for store credit and not refunded". T-2104 is about the same order, and in state/desk.json it is needs_human, with no refund or credit. The digest for T-2109 carries the order's payouts but not another ticket's status.
s2v2-1, T-2102. The grader: "The claim says the ORD-3111 standing hold was recorded in the progress file, but the RECORD shows no such progress-file entry." The reply says "I also recorded the standing hold on ORD-3111 in the progress file." memories/progress.json holds HOLD-ORD-3111, written by a str_replace during T-2102 (events.jsonl). The digest leaves the memory directory out on purpose, because notes are not a system of record.
Both replies are true by the systems of record and the agent's notes, and both failures come from what the grader's record digest leaves out. A reviewer who accepts that reading has checks that agree, and then the rest of the rule applies: S1.v1 used fewer input tokens than S1.v2 in every run (494,708 at the most, against 585,276 at the least), while their cost ranges overlap ($0.2318 to $0.2650 against $0.2224 to $0.2612). For S2, neither input tokens nor cost separate the versions: S2.v2's ranges fall inside S2.v1's. The rule is mechanical; deciding whether a failure is the agent's or the grader's is your job, and the strategy report has a field for it.
The reference strategy files are in the download, labs/solutions/S1.v2.json and labs/solutions/S2.v2.json, and the four recorded runs are in labs/starter/runs/lab2/.
More labs in this guide
Lab 1: Read the load-everything run
Replay or run S0, grade it, and read its context inventory: what each request carried, what was stale and what no ticket needed. About 35 minutes; roughly $0.32 on the live route.
Lab 3: Diagnose, fix and report
Diagnose three seeded faults from their records, fix each in a new version, show the fix, and write the strategy report. About 40 minutes; roughly $1.05 on the live route.
06Failure gallery
Thirteen ways this breaks, and how you will know
Six of these reproduce in the lab; the other seven were observed in this guide's recorded runs. Learn the symptom first; it is what you will actually see.
- F-01
P04.v1.jsonReproducibleA fresh order status ignored
- Symptom
- Observed in both runs of probe P04 on 2026-10-29 (p04-1 and p04-2), and reproducible on the scripted double: pnpm shift:run --strategy strategies/P04.v1.json --run-id p04-double --model scripted, then pnpm shift:grade --run results/shift/p04-double --claims rules. T-2109 refunds $30.00 on ORD-3104, and C-OUTCOME, C-FRESH and C-CLAIMS fail on T-2109 in both runs.
- Diagnosis
- P04 loads every order as of 09:00, like S0, but receives no notice when finance refunds ORD-3104 in full at 10:05. The only copy of the order in the window still shows a refundable balance, so the agent pays from it. The inventory of p04-1 marks that copy stale from request 14.
- Fix
- Give the agent the change: post order updates in the conversation (S0's notices), or fetch the order when a ticket needs it (S1's get_order).
- Verify
- pnpm shift:diff --a strategies/P04.v2.json --b strategies/S0.v1.json shows the same settings, and the recorded S0 runs pass T-2109 in all five. Lab 3 Step 3.1 walks it.
- F-02
R-3ReproducibleThe summarized messages left after the block
- Symptom
- Observed in the spike on 2026-10-29, and reproducible in the kit's test R-3 (pnpm test:context), which plants it on the scripted double. No error. The request after the swap carried 13,988 input tokens by its usage, where a correct swap carried 2,935.
- Diagnosis
- The block went in, but the messages it summarizes stayed after it, so "the API sends them to Claude again" (compaction on demand).
- Fix
- Remove every message the block summarizes, so the block comes first.
- Verify
- The next request's input falls well below the request before the summary, and pnpm shift:requests on the run shows the block first in every later request.
- F-03
p05-1.jsonReproducibleThe block left out of later requests
- Symptom
- Observed in both runs of probe P05 on 2026-10-29, and in the spike; reproducible offline with pnpm shift:replay --run runs/probes/p05-1.json and pnpm shift:requests --run results/replay/p05-1. No error, and every check passed. The kit's request list says: "3 compaction request(s). Of the 37 agent request(s) after the first swap, 0 carried a compaction block; 37 did not, starting at request 22." In the spike, the request with the block left out carried 1,567 input tokens.
- Diagnosis
- "If a later request leaves the block out, Claude gets no summary" (compaction on demand). The hold survived because the agent read it back from its progress file at T-2111 in both runs; without the notes, nothing in the window would have carried it.
- Fix
- Send the block as the first content of every later request, with the beta header.
- Verify
- pnpm shift:requests on the fixed run says every agent request after the first swap carried a compaction block. Lab 3 Step 3.3 walks it.
- F-04Observed
The swap's errors
- Symptom
- Observed in the spike on 2026-10-29, each a 400 invalid_request_error, with these messages: the block not first: "compaction block must be sent first, in place of the messages it summarizes; remove those messages" (compaction_block_misplaced); an edited block: "compaction block content does not match its signature" (compaction_content_mismatch); two blocks: "more than one compaction block; send only the block this conversation returned last" (compaction_block_ambiguous, a code the documentation's table did not list when it was read); a later request without the beta header: "Input tag 'compaction' found using 'type' does not match any of the expected tags", with no mention of the header; compaction and context_management on one request: "compaction and context_management cannot be used in the same request". The request after a swap fails with one of these.
- Diagnosis
- Each names a broken swap rule. The missing header is the hard one, because its message names a tag, not the header.
- Fix
- One block, first, unedited, with compact-2026-09-04 on every request that carries it, and context_management only on requests that do not ask for a summary.
- Verify
- The next request returns 200.
- F-05Observed
A summary request that calls a tool
- Symptom
- Observed in the spike on 2026-10-29: a summary request whose instructions invited a tool call came back with stop_reason "tool_use" and empty content. No compaction block in the response, and no error.
- Diagnosis
- The summarization call reads the request's tool definitions, and "A summary is produced only when the summarization call ends normally with text and no tool call" (compaction on demand). Otherwise the response is still a 200, with empty content.
- Fix
- Check stop_reason before looking for the block, and write summary instructions that do not ask for actions.
- Verify
- The response's stop_reason is "compaction" and its only content is the block.
- F-06Observed
Clearing that rewrites the cache
- Symptom
- Observed in probe P03 (S1 without clear_at_least) on 2026-10-29, and readable offline with pnpm shift:replay --run runs/probes/p03-1.json and pnpm shift:requests --run results/replay/p03-1. All checks but one passed (F-13 reads the one), and the run cost $0.4092, against $0.2390 ($0.2318 to $0.2650) for S1.v1. What clearing removed changed on 10 requests (21, 31, 36, 41, 44, 45, 50, 51, 52 and 53), and the run wrote 113,897 tokens to the cache, against 47,085 to 57,640 in each S1.v1 run.
- Diagnosis
- A clear changes the prompt from the first cleared result on, and a prompt the cache has not seen is written to it again from that point. Without clear_at_least, the API clears a little on many requests, so the prompt keeps changing. A change back to a set of cleared results used a few requests earlier can still be read from the cache, so not every change costs a full rewrite; shift:requests shows which did. In S1.v1's runs, what clearing removed changed on 3 to 7 requests per run.
- Fix
- Set clear_at_least so each clear removes enough to be worth the rewrite. S1.v1 uses 4,000 input tokens.
- Verify
- pnpm shift:requests lists fewer changes; Lab 3 Step 3.2 walks it.
- F-07Observed
The agent fetches again what was cleared
- Symptom
- Observed on 2026-10-29 in probes P02 (twice, at T-2106 and T-2108) and P03 (once, at T-2108), and in none of the 15 measured runs or the 4 Lab 2 runs. The agent fetches a ticket a second time within the same ticket, in its response to a request on which clearing had removed more tool results.
- Diagnosis
- The clear removed a result the agent still needed for the ticket in hand, so it fetched it again, as its instructions tell it to. No S1 or S2 run did this. The probes differ from them in what they clear: P02 also clears the memory tool's results, and P03, with no clear_at_least, clears a little on many requests.
- Fix
- Keep enough recent tool uses for one ticket's work, exclude the memory tool, and set clear_at_least.
- Verify
- In the run's events.jsonl, no tool is called twice with the same input within one ticket.
- F-08Observed
Memory results cleared with the rest
- Symptom
- Observed in probe P02 (S2 without exclude_tools: ["memory"]) on 2026-10-29, one run. Twice, in the middle of T-2106 and T-2108 (requests 32 and 45), clearing removed every memory result in the window; each time the agent fetched the ticket a second time and viewed its progress file again before it finished. All 12 tickets passed every check, and the run cost $0.4990 over 66 requests, against $0.4228 ($0.3766 to $0.5213) for S2.v1, which never cleared a memory result.
- Diagnosis
- Without exclude_tools, the memory tool's results count as tool uses like any other and are cleared with them, so the notes the agent read for the ticket in hand can disappear mid-ticket. One run showed no outcome cost; it cannot show that there never is one.
- Fix
- Exclude the memory tool from clearing. Anthropic's cookbook on context engineering recommends it (cookbook); the memory tool page did not mention exclude_tools when it was read.
- Verify
- pnpm shift:preflight warns about any strategy that clears without excluding the memory tool: "warning: P02.v1.json clears tool results without excluding the memory tool."
- F-09
M-1 to M-3ReproducibleA memory path that escapes the memory directory
- Symptom
- Reproducible with pnpm test:context: tests M-1 to M-3 send traversal paths, links that leave the folder and oversized files to the kit's handler. A memory command names a path such as /memories/../../secrets.env.
- Diagnosis
- The API defines the memory tool, but your code runs every operation, so your code decides what a path may reach.
- Fix
- Resolve every path inside the run's own memories/ folder, refuse anything that leaves it, including through links, and cap file sizes.
- Verify
- The tests pass, and nothing outside the folder changes. In the spike, an earlier version of the handler failed this test on a dangling link, which is why the kit checks links with lstat.
- F-10
s2-1.jsonReproducibleSpend under-counted from the top-level fields
- Symptom
- Observed in every recorded run that compacted, on 2026-10-29, and reproducible offline: after pnpm shift:replay --run runs/measured/s2-1.json, pnpm shift:requests --run results/replay/s2-1 prints the estimate summed over usage.iterations, and the run's result.json keeps the top-level figure as top_level_estimate_usd. In each of the 13 recorded runs that compacted, the cost from the top-level usage fields came out $0.0205 to $0.1281 lower than the sum over usage.iterations, 8 to 25 percent of the run. In s2-1 it was $0.3305 against $0.4075.
- Diagnosis
- Each summary is a compaction entry in usage.iterations, and the summary request's top-level fields were all zero. "To count what a conversation consumed, sum across usage.iterations, not the top-level fields" (compaction on demand).
- Fix
- Sum every iteration, and price cache writes and reads at their own rates.
- Verify
- The kit's estimate for each run matches a recomputation from its usage.
- F-11
K-5ReproducibleNotes that claim a refund the desk does not hold
- Symptom
- Reproducible with pnpm test:context: test K-5 removes T-2101's refund from the desk after an offline S2 run, while the progress file still lists it. The notes say "refund", and C-OUTCOME and G02-STATE fail on T-2101.
- Diagnosis
- The memory directory is context the agent wrote, not a system of record. The checks read the desk.
- Fix
- Grade outcomes from the systems of record, and treat notes as claims to check.
- Verify
- The test passes: the checks fail the ticket even though the note is there. In the 10 recorded runs that kept notes, every payout the notes named, 50 in all, exists on the desk.
- F-12Observed
Trimming an earlier turn before a thinking block
- Symptom
- Observed in the spike on 2026-10-29: a request that removed part of an earlier tool result in front of a thinking block was accepted. With the beta header thinking-binding-controls-2026-08-01 and thinking.block_binding.prefix_mismatch_behavior set to "error", the same request returned a 400: "Invalid signature in thinking block. The block is bound to a different conversation." With "drop_block" it returned 200, and the response listed the dropped block in input_transformations with the reason prefix_binding_mismatch. A request that edits anything before a thinking block fails with that 400, or, on an account like the one used here, succeeds with no sign of trouble. The preserved thinking page explains the difference in a table for requests that leave prefix_mismatch_behavior unset: on Claude Sonnet 5.5, accounts created on or after August 31, 2026 get a 400 error, and older accounts get "No error (failing blocks reach the model)". As the page puts it, "A run with no errors on your own API key doesn't prove that your code keeps the prefix intact."
- Diagnosis
- The system prompt, the tools and the messages before a thinking block are its prefix, and a client-side edit there invalidates that block and every thinking block after it. The API's own clearing is different: on Sonnet 5.5, "server-side context management never invalidates thinking blocks" (context editing).
- Fix
- Keep system and tools fixed and only append to messages; remove old tool results with the API's context editing, not by editing earlier turns yourself.
- Verify
- Send the beta header with prefix_mismatch_behavior set to "error" on the fixed request. It returns 200 where the trimmed request returned the 400.
- F-13Observed
The claim check's own mistakes
- Symptom
- Observed on 2026-10-29 in the claim grader's controls and in the runs. Under record digest v6, the grader judged 1 of its 11 controls wrongly: C9, a reply that gives T-2109's requested amount as $55.00 (it is $30.00), which it called consistent. In the runs, it failed p03-1's T-2110 for a sentence no record shows, that the earlier refund "goes back to your original payment method", and passed the same kind of sentence in 66 other replies across 18 runs. It also failed two true statements that its digest leaves out: s1v2-2's note about another ticket, and s2v2-1's about the agent's own notes.
- Diagnosis
- C-CLAIMS is a model reading a record digest. It misses what the digest leaves out, such as the agent's notes, and it is not consistent on details no record states.
- Fix
- Read every claim failure against the records before ranking on it, and say in the report whether it is the agent's or the grader's. The record digest was extended three times during the measurements, from v3 to v6, for this reason (see Measuring the strategies).
- Verify
- Each claim failure in your report names the record that confirms or contradicts it.
07Assessment
Transfer task and rubric
Review a team's proposal to change its support agent's context strategy: inventory a request from each strategy, recommend a versioned one, report every check for every run, and read each failure.
| Criterion | 0 · Emerging | 1 · Developing | 2 · Proficient | 3 · Exemplary |
|---|---|---|---|---|
| Context inventory | A stale piece marked current, or fewer than half of the 17 kinds right | Every stale mark right, but a stale time missing, fewer than 14 of 17 kinds right, or what a request is missing not named | Every stale mark right with its time, at least 14 of 17 kinds right, and what a request is missing named | Every kind, stale mark and Needed answer right, and what is missing named |
| Versioned strategy | No strategy file, a file that does not load, or a recommended strategy that the task-level results rank lower | A file that loads, but a measured file changed under its old version, or a recommendation the results do not support | The recommended strategy submitted unchanged, matching the report's Recommendation | As Proficient, plus a next version of the other strategy that changes only the settings its failures point to |
| Task-level results | A run or a failed check dropped (critical), or a report the check cannot read | Every run and failed check counted, but token or cost figures that do not match the runs | pnpm shift:report-check passes on the report beside the case's runs | As Proficient, and every failing run named by id in Failures read |
| Failure analysis | Two or more failed checks missing, or the agent's failures called the grader's | Every failed check named, but one assigned to the wrong side or without the record that decides it, or one failed check missing | Every failed check named and assigned rightly, each with the record that decides it | As Proficient, and the agent's failures traced to their cause in the strategy file |
| Recommendation | A recommendation that the task-level results rank lower, or one that rests on tokens or cost with no task-level result in its reasoning (critical) | The strategy the results support, but the Why does not put the failed checks first, or the limits leave out n, the one shift or that the runs were constructed | The strategy the results support, with the task-level results first, each failure's side named, and limits naming n, one shift and constructed runs | As Proficient, and the report says what must be measured before the other strategy could return |
Proficiency standard: Proficient or higher on every criterion. Proposed local standard, not an official certification.
The full brief
You receive a case file you have not seen: a team's proposal to change its support agent's context strategy, with the strategy files, and run records for two strategies on a shift like this guide's. The run records were constructed for the assessment, and the case file says so. You hand in:
A context inventory of one request from each strategy, naming each piece's kind, what is stale and what no ticket needed.
The versioned strategy you recommend, as a file.
The task-level results: every check for every run, failed runs included, with n.
A failure analysis: each failed check, what the records show, and whether it is the agent's failure or the grader's.
A strategy report from report/strategy-report-template.md that passes pnpm shift:report-check.
Each criterion is scored Emerging (0), Developing (1), Proficient (2) or Exemplary (3), and the pass rule is Proficient or higher on every criterion. Any one of these fails the submission outright: a recommendation that rests on tokens or cost without the task-level results beside it; a results table that drops a failed run or a failed check; an inventory that treats a superseded policy or a stale status as current evidence; a report built from personal or production data. pnpm shift:report-check catches numbers that do not match the cited runs. It cannot judge a reading or a recommendation, so an instructor grades those against a reference reading of the case's records.
08Instructor kit
Teach it to a room
Facilitation guide
A run of show for a 12-person lab of about 170 minutes, with roles, misconceptions to listen for, hint ladders, troubleshooting in the room and the live spend per learner.
A 100-person offline day
Everyone on the offline route, with no keys and no spend; breakout groups of about ten with one helper each and a help queue; and checkpoint lines posted at the end of each lab. These are scenario designs, not staffing ratios, until a pilot records queue length and time per checkpoint.
Dry run and observation
A train-the-trainer sequence and a 45-minute rehearsal in front of an observer, with a seeded failure, an unexpected question and a calibration scoring, a readiness rubric and a proposed clearance rule. No dry run of this module has been observed yet.
Clearance record
A template, one record per instructor, module version and audience, filled in only from an observed dry run: the scores by dimension with their evidence, the decision by an authorized person, any restrictions and when to reassess. No dry run of this module has been observed yet.
Evaluation plan and pass-rate report
A plan for a diagnostic, checkpoints, feedback questions and a proposed transfer task, scorer calibration and privacy, and a monthly template that reports first-attempt and eventual pass rates with their denominators and a criterion breakdown. It stays blank until the module is taught.
10Sources and verification
- [1]Models overview · platform.claude.comchecked Oct 29, 2026
- [2]Context windows · platform.claude.comchecked Oct 29, 2026
- [3]Pricing · platform.claude.comchecked Oct 29, 2026
- [4]Versions · platform.claude.comchecked Oct 29, 2026
- [5]Context editing · platform.claude.comchecked Oct 29, 2026
- [6]Compaction (overview) · platform.claude.comchecked Oct 29, 2026
- [7]Compaction on demand · platform.claude.comchecked Oct 29, 2026
- [8]Compaction at a token threshold · platform.claude.comchecked Oct 29, 2026
- [9]Memory tool · platform.claude.comchecked Oct 29, 2026
- [10]Prompt caching · platform.claude.comchecked Oct 29, 2026
- [11]Token counting · platform.claude.comchecked Oct 29, 2026
- [12]Mid-conversation system messages · platform.claude.comchecked Oct 29, 2026
- [13]Preserved thinking: keeping the prefix unchanged · platform.claude.comchecked Oct 29, 2026
- [14]Context engineering: memory, compaction, and tool clearing (cookbook) · platform.claude.comchecked Oct 29, 2026
- [15]Effective context engineering for AI agents · anthropic.comchecked Oct 29, 2026
- [16]Effective harnesses for long-running agents · anthropic.comchecked Oct 29, 2026
- [17]Lost in the Middle: How Language Models Use Long Contexts (arXiv 2307.03172) · arxiv.orgchecked Oct 29, 2026
- [18]DOI handle record for 10.1162/tacl_a_00638 · doi.orgchecked Oct 29, 2026
- [19]Context Rot: How Increasing Input Tokens Impacts LLM Performance · trychroma.comchecked Oct 29, 2026
- [20]Anthropic TypeScript SDK changelog · github.comchecked Oct 29, 2026
- [21]npm registry: @anthropic-ai/sdk · registry.npmjs.orgchecked Oct 29, 2026
- [22]Corepack README · github.comchecked Oct 29, 2026
- [23]pnpm installation · pnpm.iochecked Oct 29, 2026
- [24]Node.js downloads · nodejs.orgchecked Oct 29, 2026
- [25]Get started with Claude · platform.claude.comchecked Oct 29, 2026
- [26]Rate limits · platform.claude.comchecked Oct 29, 2026
- [27]Tool use overview · platform.claude.comchecked Oct 29, 2026
Independent work. Not affiliated with or endorsed by any vendor named in this guide.

Written by
Jordan Hudgens
Technical educator and AI engineering leader. 16 Udemy courses, 111K students, and curricula used by 250K+ learners.